This week, we experimented which amounts of coffee and water go well together in order to produce the most coffee extract. We were also preparing for our first oral presentation on our experimental results so far, as well as tying these experiments to lycopene extraction.
Coffee:Water Ratio Experiment
The experiment was set up as follows: There were three different trials having three different coffee beans:water ratios. The experiment started with 2.5g of coffee beans, then 5g of coffee beans, and then 10g of coffee beans. We predicted that the amount of water is dependent on each scenario but should be around 100-300mL as we have experimented in week 4. We kept the temperature of water constant (40°C) as well as used small particle sizes for each trial.
We had a certain number of cups laid out, letting the coffee brew over one cup and then changed between cups in 30-second intervals for a certain amount of time (150 seconds or above). After letting the liquids sit to obtain room temperature, we measured the volume of each cup as well as the conductivity.
The raw data we needed to collect is the initial mass of coffee grounds (
$$$m_1$$$) used for each trial as well as the amount of water used ($$$v_1(t)$$$), the volume of coffee extract achieved for each cup ($$$M_1(t)$$$), and the measured conductivity ($$$c_1(t)$$$) of each cup.
We used this data to construct adjusted extraction ratio vs time to compare which coffee:water ratio is best at brewing coffee. With $$$m_1$$$ being the mass of the initial coffee grounds, $$$v_1(t)$$$ being the volume for each cup, and $$$c_1(t)$$$ being the measured concentration, the mass of extracted coffee should be $$$M_1(t)=v_1(t)c_1(t)$$$. To measure the effectiveness of using $$$m_1$$$ grams of initial coffee, we compared the ratio $$$r_1(t)=\sum_{a=0}^tM_1(a)/m_1$$$ for each experiment of each time step.
We expected to find that the $$$r_1(\infty)\approx r_1(150s)$$$ratio to be roughly the same for all 3 experiments because intuitively, the same temperature and the same grain size would result in the same final concentration per initial $$$m_1$$$. However, the larger $$$m_1$$$ should be more practical to scale up to an industrial scale because we can extract more coffee at once before we need to replace the coffee grounds. We solved for the slope equation in each of the trials by graphing $$$r_1(t)$$$ on the y-axis and time on the x-axis with the usage of Excel. After a lot of time, they should all approach the same value, but the larger $$$m_1$$$ should approach it faster.
Results
Experimental Goal: To determine what coffee grounds:water ratio results in the most efficient coffee extraction
Experimental Questions:
- What is the difference between the conductivities and concentrations of the three different amounts of coffee beans? If they do differ then why do smaller/larger amounts of coffee beans result in different concentrations?
- Since the flow rate cannot be controlled, how is it different between the different amounts of coffee beans based on the collected data of volume?
- How does the amount of water affect how much coffee is extracted?
Answers:
According to Graph 1 and Table 1, we can see that the 10g of coffee beans results in the most coffee extract concentration. However, based on Table 1, we can see that each member has different amounts of volume of water used for all the trials. If we look at the extraction ratio located at the rightmost column of each trial, we can see that the ratios are basically the same between all the trials. We can also see this in Graph 2. Therefore, it really depends only on how much initial coffee mass is used. There could also be other factors affecting the volume of water, such as different coffee filter paper or different coffee filter cones since the amount of holes on the cones can vary. Another source of error is distributional shift coming from imprecise calibration curves when measuring conditions are different, especially when baseline water has a non-zero conductivity.
In general, larger amounts of coffee (with roughly the same amount of water) resulted in proportionally higher conductivities of coffee, which led to proportionally higher concentrations of coffee (see Graph 1).
The amount of coffee beans changes the amount of coffee solubles for the water to extract. Assuming the maximum solubility of coffee in water hasn’t been reached, larger amounts of coffee beans should increase the concentration of coffee (see Table 1). If maximum solubility of coffee in water has been reached, then larger amounts of coffee beans should only proportionally increase the concentration.
According to Table 1, we can see that the volume of water used for each trial differs greatly. If we look at Table 1a, we can see that the 2.5g and 5g trial used relatively the same amount of water, but the 10g trial used 473mL of water. If we look at Table 1b, we can see that the 2.5g trial used the most water while the 10g trial used the least amount of water. Next, Table 1c depicts that the 5g trial used the most amount of water while the 10g trial used the least. Finally, Table 1d depicts that 2.5g trial used the most water while the 10g trial used the least. Based on our data, we cannot rank the flow rate of each trial. Again, our volume data may be fluctuating because of the usage of different coffee filter paper or using a coffee filter cone from different manufacturers.
Again, we cannot determine the relationship between the amount of water used and the amount of coffee extracted because when comparing our data together, there is no common trend. This suggests that the amount of coffee extracted is independent of the amount of water used.
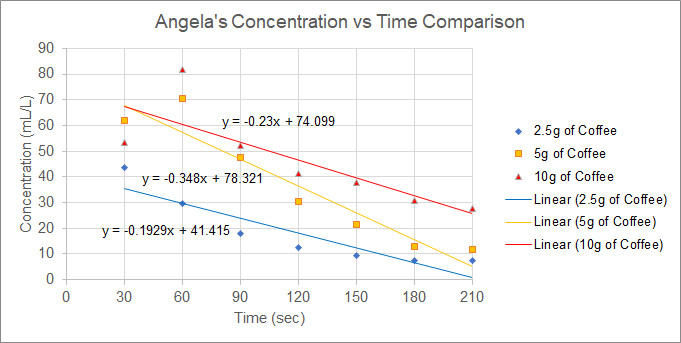
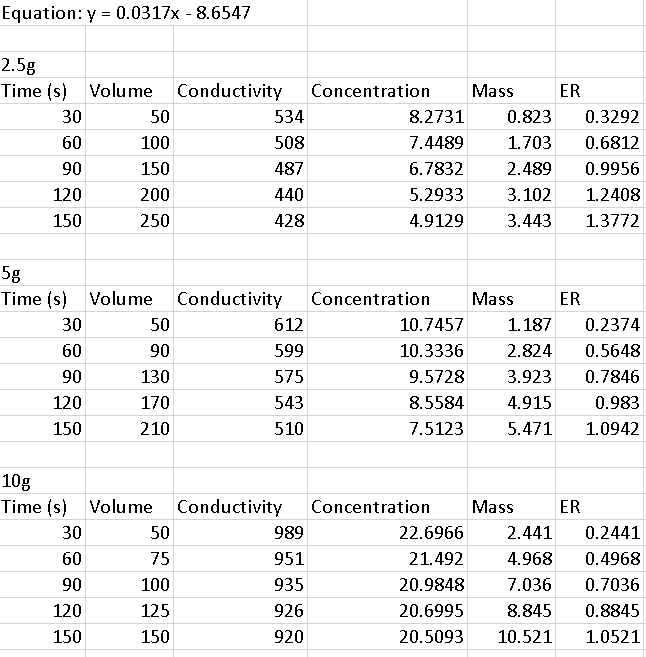
Graph 1. Larger coffee:water ratios resulted in higher overall concentrations over time based on Angela’s data
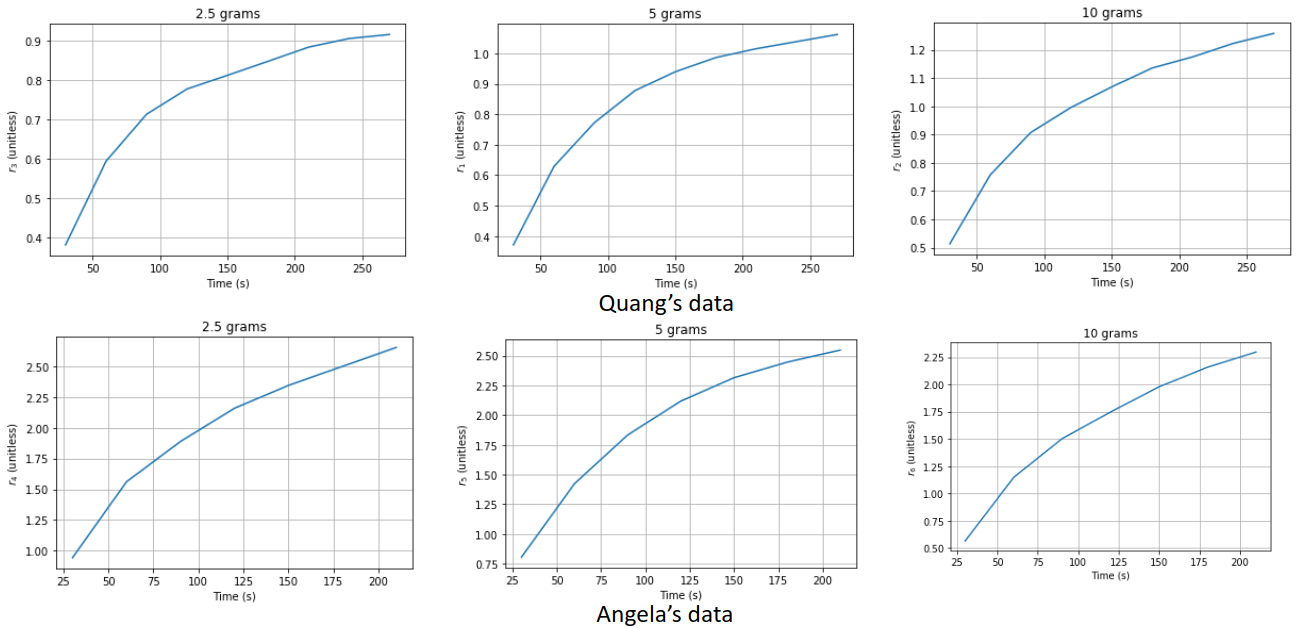
Table 1a: 10g of Coffee Beans has Largest Amount of Volume of Water Used and has Highest Concentration Value Set Compared to Other Trials Based on Angela’s Data
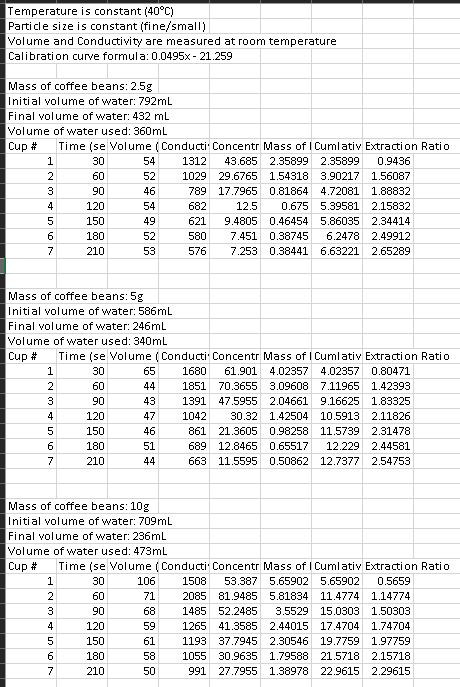
Table 1b: 2.5g of Coffee Beans has Largest Amount of Volume of Water Used and 10g of Coffee Beans has Highest Concentration Value Set Compared to Other Trials Based on Chris’s Data
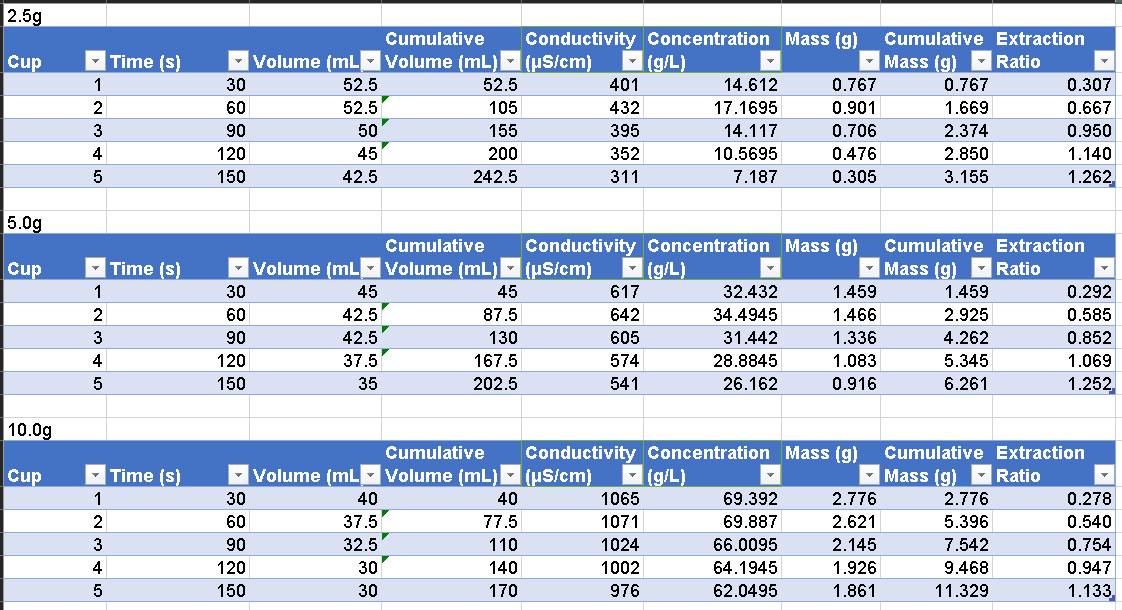
Table 1c: 5g of Coffee Beans has Largest Amount of Volume of Water Used and 10g of Coffee Beans has Highest Concentration Value Set Compared to Other Trials Based on Quang’s Data
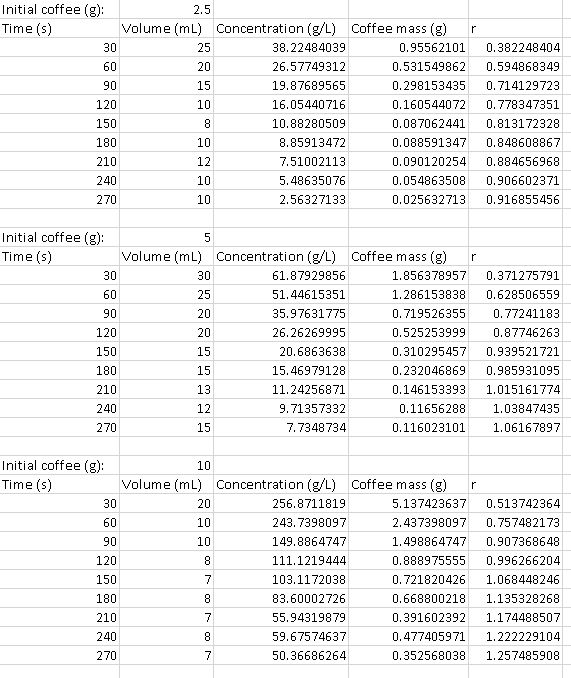
Table 1d: 2.5g of Coffee Beans has Largest Amount of Volume of Water Used and 10g of Coffee Beans has Highest Concentration Value Set Compared to Other Trials Based on Jacob’s Data