This week, we wanted to redo the coffee:water ratio experiment with modifications. Instead of letting the volume of water used vary, we set the volume of water to 200 mL. This means that the amount of time was dependent on how fast the water is used up. We still did the 30-second interval per cup, but the amount of cups varied. In short, this experiment is very similar to the first coffee:water ratio experiment, except that the volume of water is constant. The experimental goal is the same too, which is to determine what coffee:water ratio is best at extracting coffee.
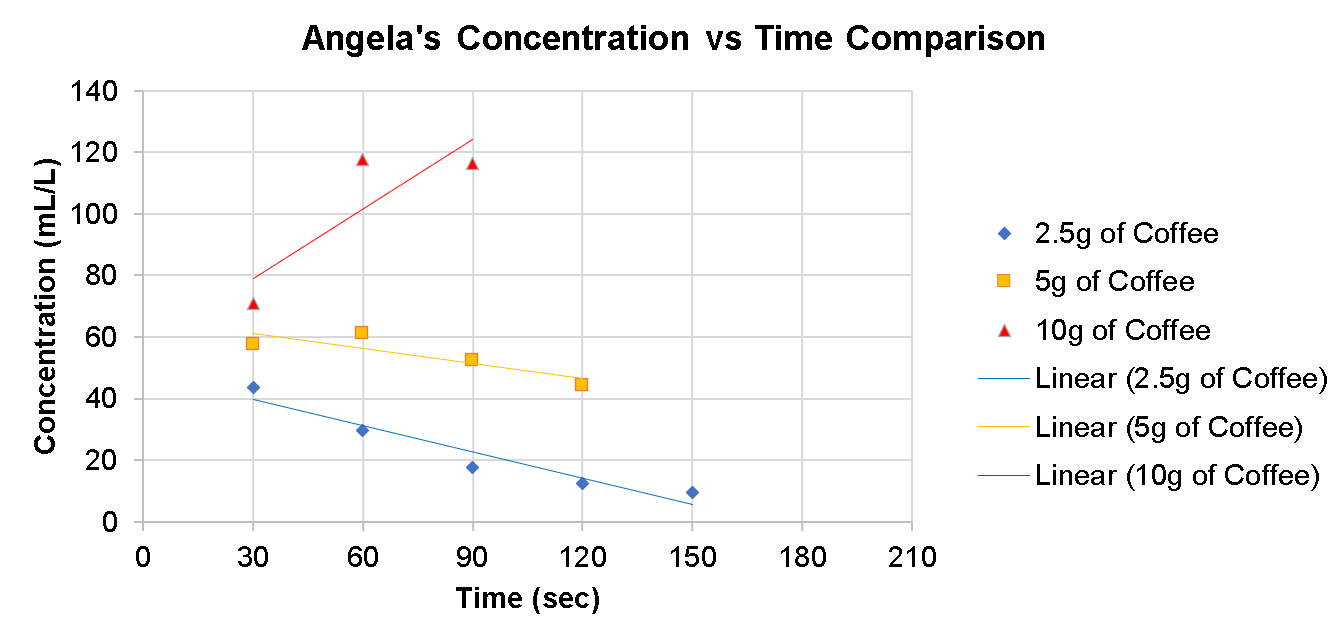
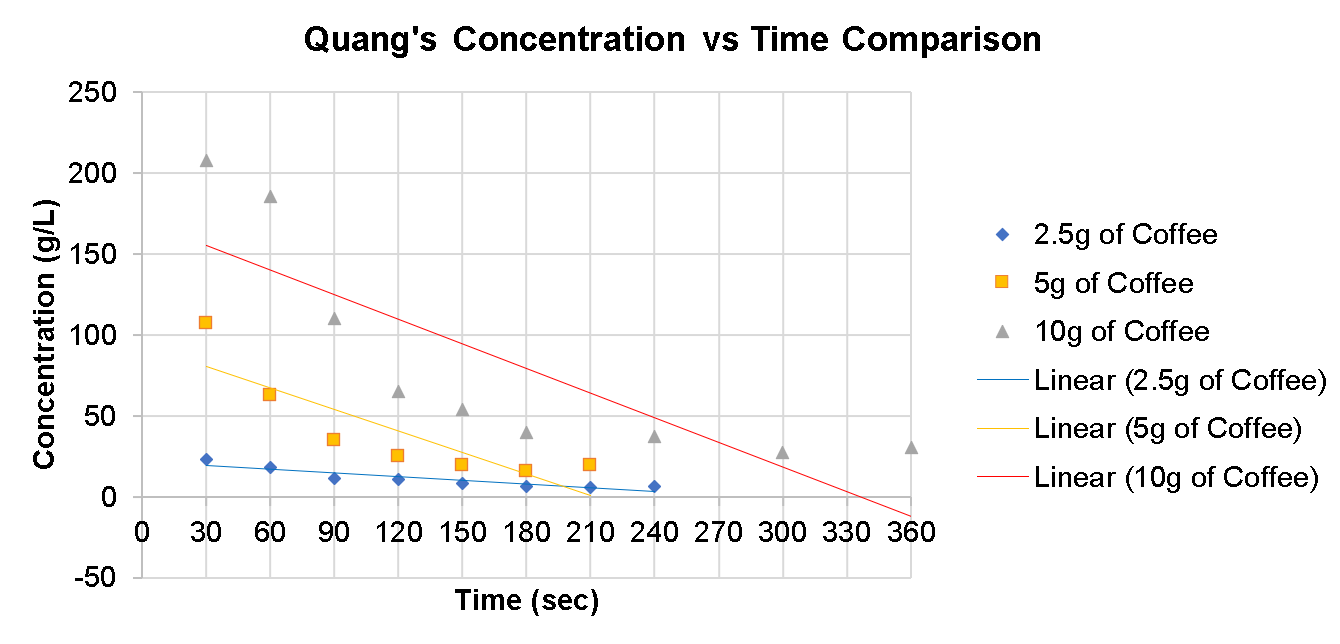
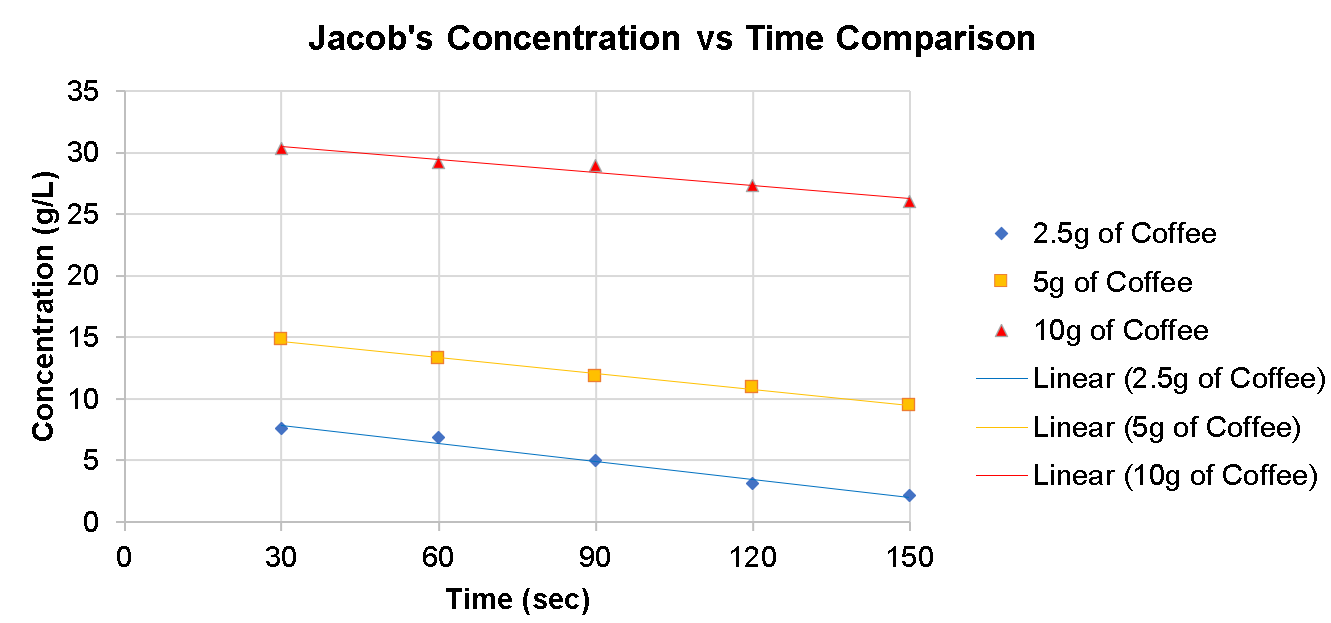
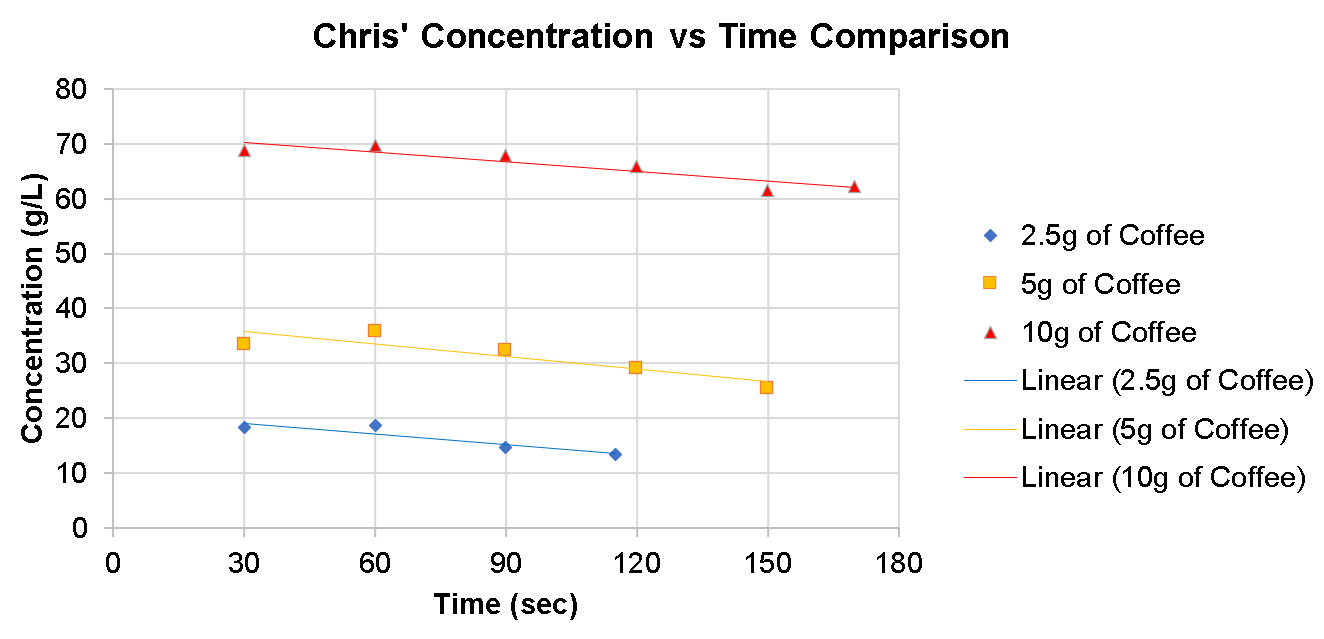
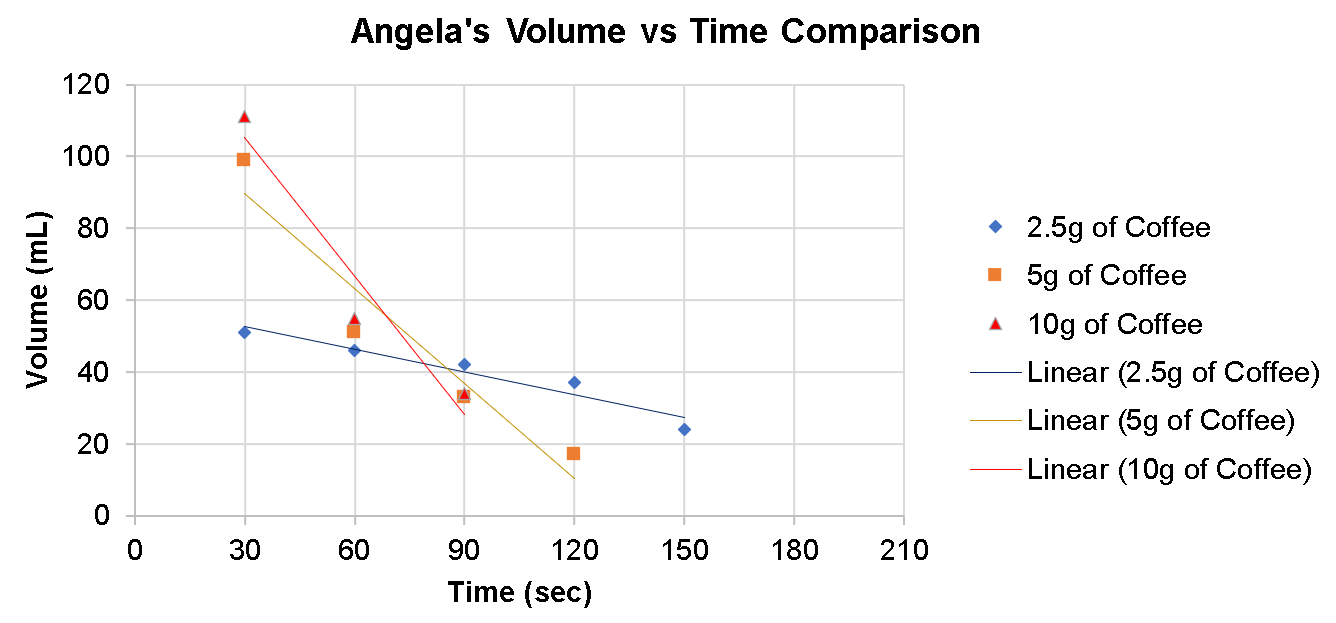
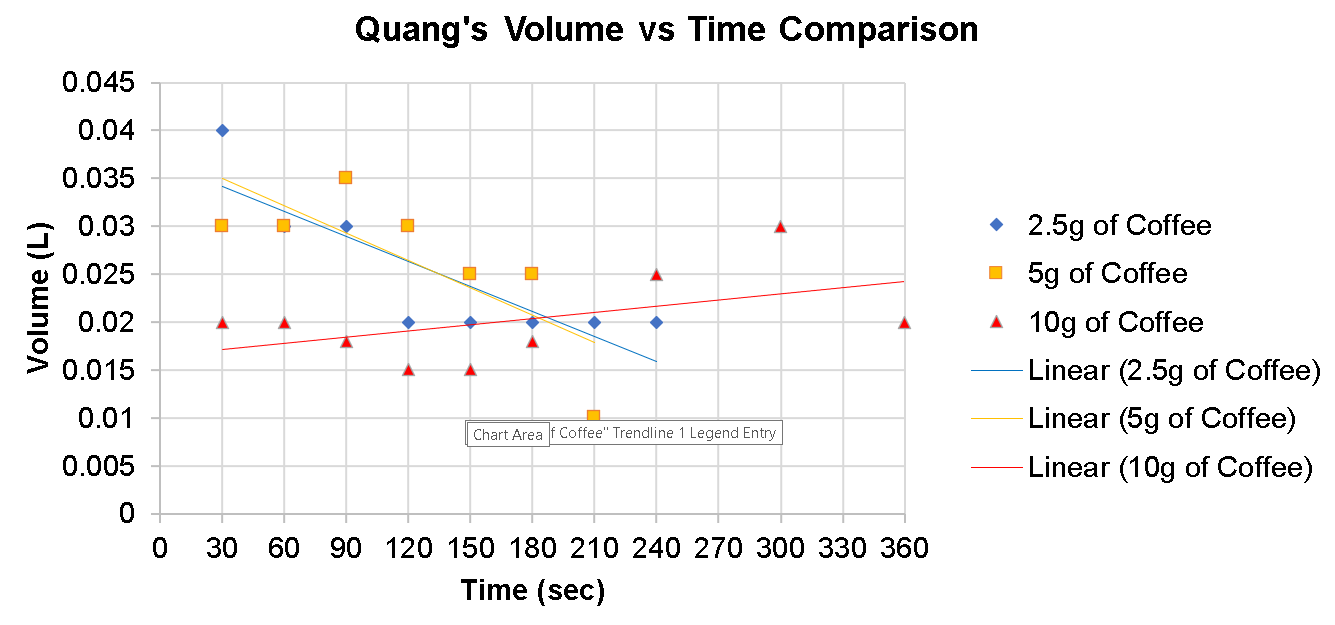
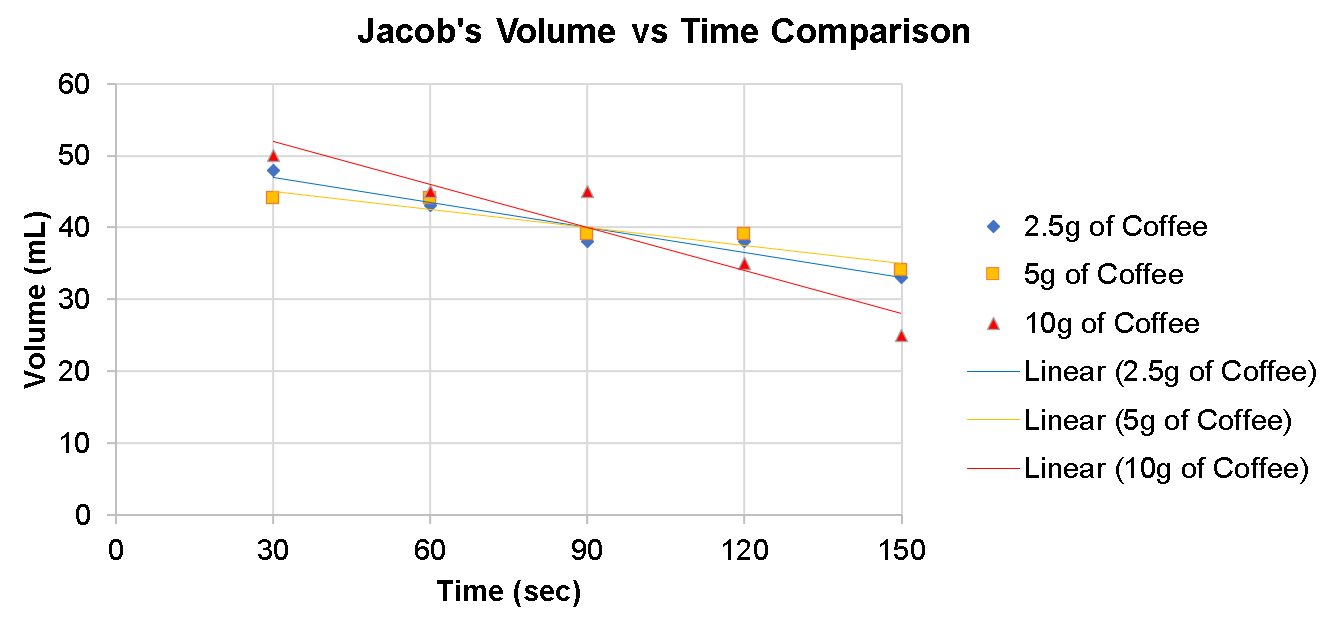
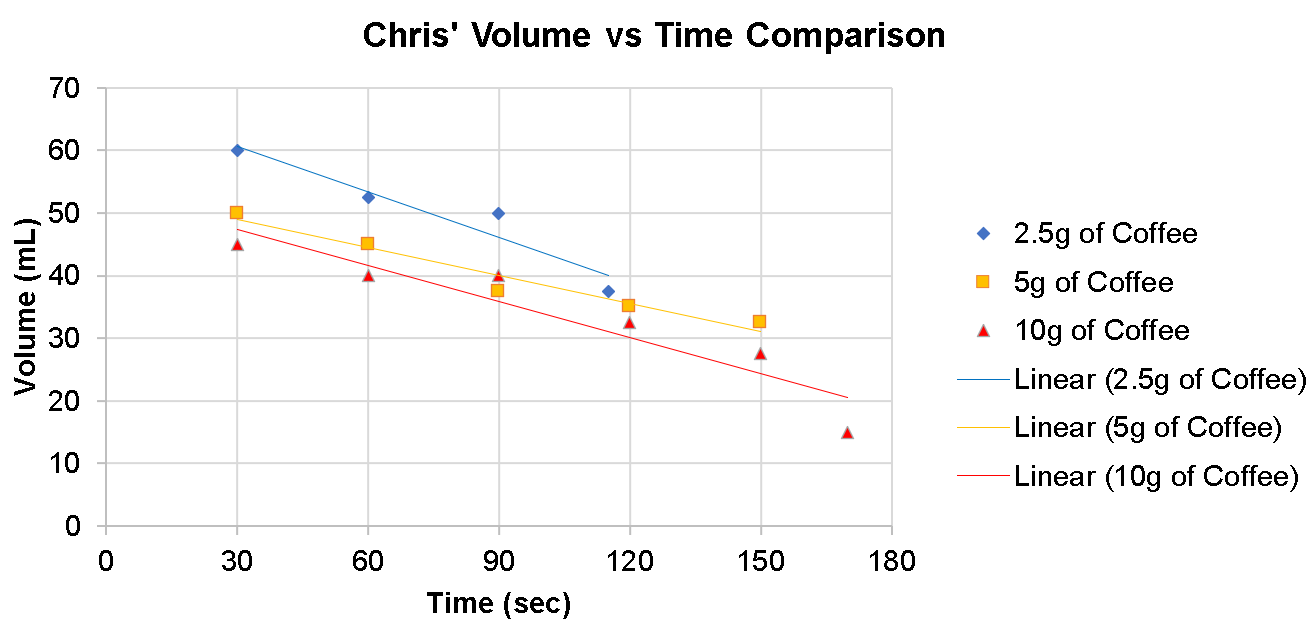
As a group, we compared our concentration versus time graphs and volume versus time graphs. We saw that during most of the trials, the maximum concentration occurred at the beginning of the extraction than at the middle or end, with 10 g of coffee having the highest concentration overall. This may be because the 10 g of coffee has more coffee solubles at the beginning than 5 g or 2.5 g of coffee. We also saw that most of the linear trendlines on the volume versus time curves are negative, indicating a decreased flow rate as time increases. This may be because of the coffee grounds getting more and more stuck in the filter paper as time goes on. This analysis helped us determine what coffee:water ratio is best at extracting coffee, which is 10 g of coffee beans per 200 mL of water with the best extraction time at 30 or 60 seconds.