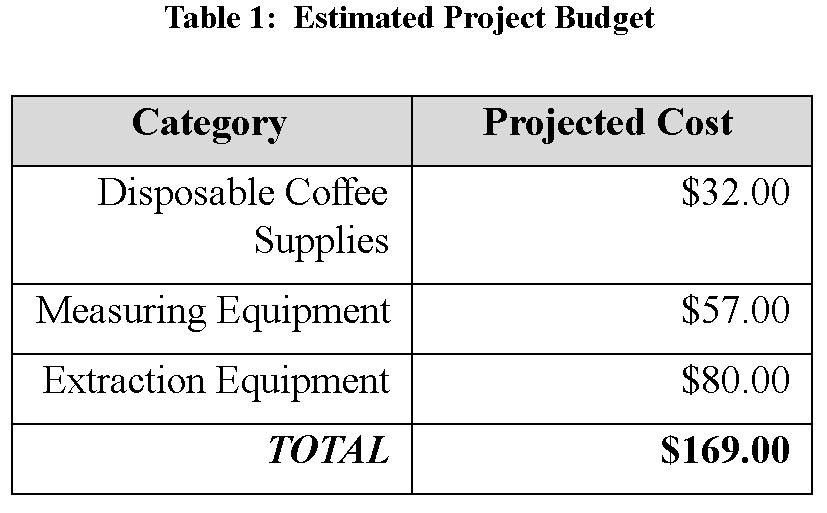
For week 3, we had to create the proposal for the experiments we will be conducting for the next few weeks. This served to give the purpose of the experiments along with the necessary steps in order to achieve the results, while also outlining potential hazards and cost of equipment that come with conducting the experiments.
Because extracting lycopene at home is fairly expensive and requires a lot of equipment that not everyone may have, replicating the experiment using coffee should give a fair idea of what variables affect lycopene extraction from tomatoes. Ultimately, the proposal lists out everything that is needed to complete the experiment, from the cost of materials to the amount of knowledge needed before you conduct the experiment, along with the safety risks of the experiment.
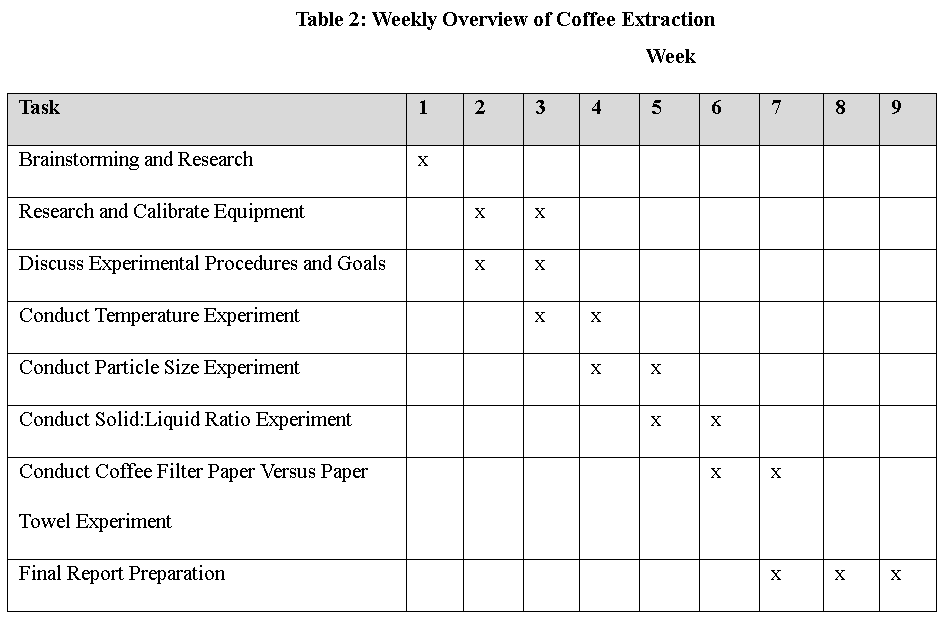
It is important to map everything out from the start in order to see if the experiment is even viable at home, especially safety since no-one wants to do an experiment that puts others at risk in their home. Once everything was mapped out, it seemed feasible enough to be done by everyone in our group and repeatable so that it matched up with the timeline that we were given.
Temperature Experiment
This week, we conducted an experiment to determine which temperature results in the most efficient coffee extraction.
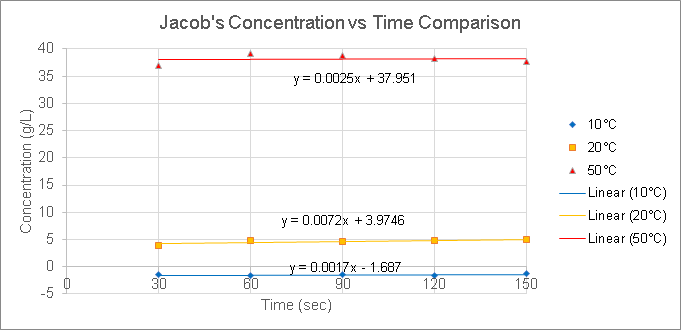
We did three trials, each at a different temperature of water, roughly 10°C, 20°C, and 50°C. In each trial, we grounded 5 g of coffee at a constant particle size. We then set up a pour-over coffee filter with the coffee grounds. We measured the initial temperature of the water, then poured it over the filter and started a timer. Every 30 seconds for two-and-a-half minutes, we recorded the temperature of the coffee, as well as the coffee’s conductivity. After we finish the experiment, we will convert conductivity to concentration using our calibration curve from Week 2. Finally, we will create a concentration over time graph to answer our goal and experimental questions.
The experimental results are as follows:
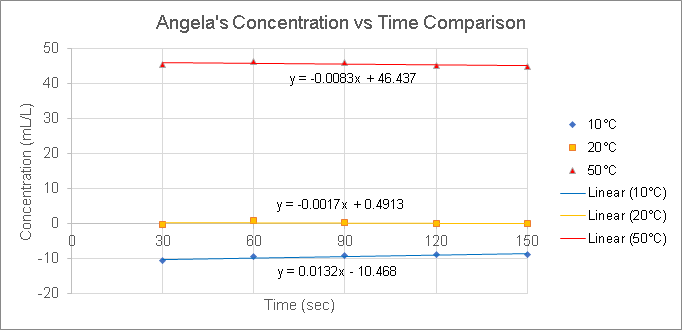
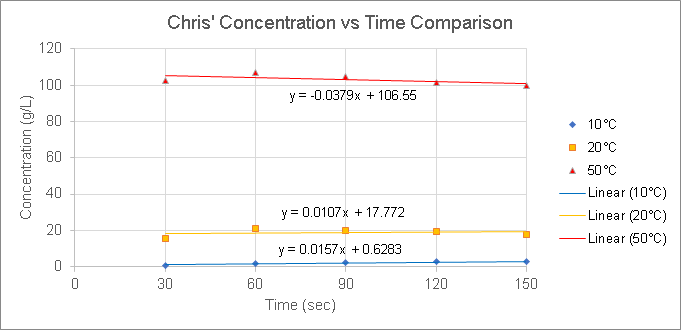

Results
Based on our results, we concluded that 50°C is the most efficient temperature at brewing coffee. Since the concentrations of 50°C were the largest values compared to the other temperatures, this means that there is a larger amount of coffee extracts in brew than the amount of water.
Experimental Questions
How can you tell which coffee extraction temperature is most efficient?
Does an increase in temperature always result in the most efficient extraction?
How will different temperatures of water affect the calibration curve?
Answers
By comparing the concentration values of each temperature set, we can find out which coffee extraction is efficient. The lower the concentration value, the less efficient it is. The higher the concentration value, the more efficient it is. The reason is that since concentration is calculated as grams (or mL) of coffee extracts in brew over liters of water, then the best efficiency would have a greater amount of extracts than water, which is illustrated by high concentration values.
As far as we know from the temperatures tested and our data, an increase in temperature results in an increase in concentration, which illustrates how efficient the extraction is. However, we cannot determine whether an increase in temperature ALWAYS results in the most efficient extraction because we only tested temperatures up to 50°C.
The method that we used resulted in different temperatures not affecting the calibration curve. Since we used a different calibration curve equation to convert from conductivity to concentration, it resulted in the equations for each of the calibration curves being the same.